One of the more confusing parts of buying a home in Lake Tahoe real estate is understanding the market. The shape of the Tahoe Real estate market will determine how far your dollar will take you. Buyers seek to get a low price on a home and when the time comes to sell the home, hopefully the value has gone up, resulting in a profit. Around the end of 2006 / start of 2007, the Lake Tahoe real estate market was doing better than ever, and it was a great time to sell. One year later, and the market had completely changed, for the worse. Home values were dropping rapidly. If you had the money, this was the time to buy. We’ve seen both a very strong, and a very weak real estate market this decade in the Lake Tahoe area. Now, things are starting to look normal again. In the real estate market, normal is best because both the buyer and seller have peace of mind. Below are the numbers for sold homes, condos and lots in the Lake Tahoe area for the past 3 years. Please note that these are categorized by area, and year.
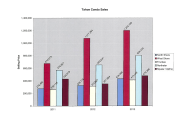
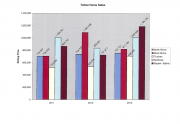
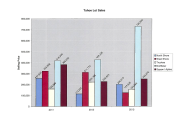
These charts show the completed sales in the last 3 years by area. This data is helpful because it shows how the real estate market differs between subdivisions of the Lake Tahoe area. For example: in the condo sales graph, it’s easy to at first glance see that condos on the west shore are pricier than condos in other areas (and that prices have risen in the last 3 years). We can also quickly notice that the market for condos at Squaw and Alpine haven’t grown as rapidly as other areas. This is all useful information for buyers and sellers.. but what if we are interested in the market as a whole? We’ll need a new chart for that:
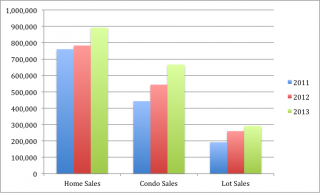
Real Estate Sales in Lake Tahoe:
This chart shows the averages for real estate sold the entire Lake Tahoe area. Each number represents for an average of the 5 areas (North Shore, West Shore, Squaw / Alpine, Truckee, Northstar) shown in the chart above. So, instead of looking at numbers for Truckee or West Shore.. we are looking at the Lake Tahoe area as a whole. At first glance, you will notice that homes typically cost more than condos; and condos typically cost more than lots (no surprise there). We can also see that over the last 3 years, prices have risen, which indicates a strengthening market!


Leave a Reply